Generate Code Quality PDF Report with SonarQube
July 31, 2020
SonarQube is a tool made by developers for developers. Provides everything your need to write clean and secure code from the first moment and to manage technical debt so that your development is sustainable.
But what happens if you want to extract code quality data and generate a quality report for your projects?
SonarQube does not offer by default any simple reporting management, although you can use the web API to develop your
custom report, in most cases you need something faster and easier.
How to generate PDF form SonarQube?
With bitegarden Report for SonarQube these reports can be generated in the simplest way possible.
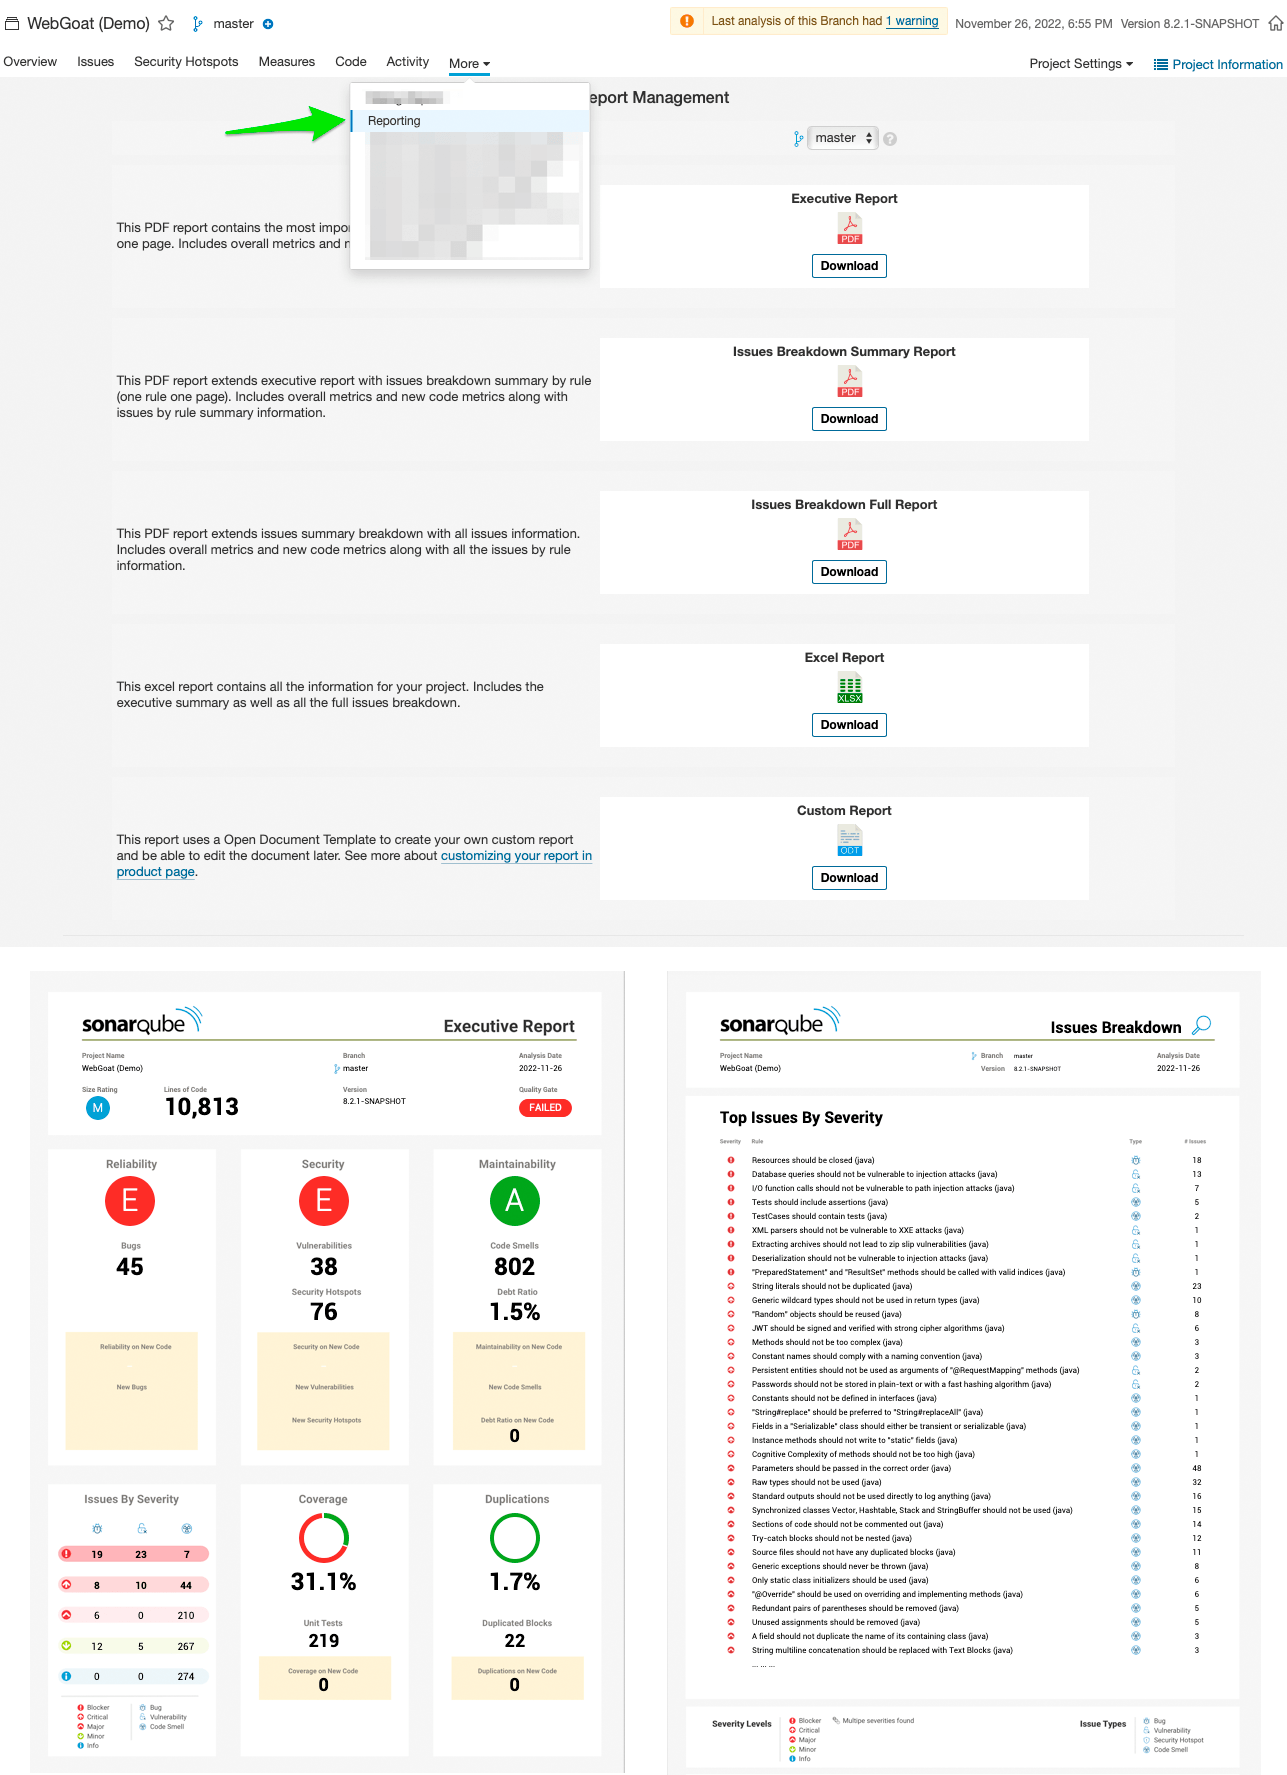
Browsing the project space in the “More …“ option you will find a section that provides all the reports that you need, from an executive summary to a report with all the issues found. Just download the desired report by clicking on the corresponding download button.
In the following image we show you a screenshot of our SonarQube instance so you can find this aspect:
Setup your custom footer logo
By default the plugin will use bitegarden logo at each page footer, but if you need it, you can change it from the plugin configuration so that the logo of your organization or even the logo of your project is used.
If you want to change the logo for all your project in SonarQube, just go to the plugin general configuration (Administration -> General Settings –> bitegarden Report) and setup the URL of the logo that you want to appear in the footer.
Here’s a screenshot to see where you can change the logo and the final result with an example:
![]()
Footer image settings
![]()
Report Sample with custom logo
Different Reports, different goals
Each team member may require a different type of report. Initially we thought that certain team roles
were going to access SonarQube to see code quality details, but we noticed that this is not the case, and
that there are many team roles that do not access the tool and therefore need to work with reports in
different formats.
Executive Summary Report (PDF)
Goal: quickly check if the project quality is good or bad, and the main values for each code quality metrics analyzed
We already talked about this report when we released 2.0 version. It is a one page report with the most important information of code quality for our project, and includes:
– The three main ratings: reliability, security and maintainability
– Duplicated Lines Density
– Code Coverage and unit testing
– Blocker and Critical Issues with bugs, vulnerabilities and code smells.
And it includes main metrics and new code metrics.
DOWNLOAD EXECUTIVE SUMMARY SAMPLE >
Issues Breakdown Summary Report (PDF)
Goal: get issues summary for our project (most common, by severity) with a one-page rule summary with the main issues found (file, line and message)
This report is available from version 2.1 and includes executive summary and new report sections:
– Most common issues: a list with the most common issues. Rules with more issues will appear first.
– Issues by severity: a list with issues by severity. Rules with higher severity will appear first.
– Issues Breakdown by rule: one page for each rule with a small description, and the list of issues found for the rule.
This report allows us to send the report to external teams that are not used to login to SonarQube or it could work as an code quality audit for a project, where you can find the main issues.
DOWNLOAD BREAKDOWN SUMMARY SAMPLE >
Issues Breakdown Full Report (PDF)
Goal: see all the issues of our project
This is the most complete report (and the “bigger”) because it includes all the previous reports and all the issues for each rule. If a rule has 50 issues, then the report will include the location of all of them (file, line and message).
This report includes ALL the information about code quality for your project. You can send this report to anyone that needs to perform a code review or audit.
DOWNLOAD BREAKDOWN FULL SAMPLE >
Custom Metrics Report with Open Document (ODT)
Goal: create custom metric reports in open format that can be easy edited later
This report can be created using an Open Document file (ODT).
You can create a completely new report with customized sections and texts, styles, tables, …
It is based on FreeMarker templates and you can use variables and insert them in your Open Document. Our plugin will replace variables with values from SonarQube analysis. More info about how to use it here.
Discover new report samples
If you want to check how it works then you can download the trial version for 14 days or access to our demo instance and check any of the available projects, like Apache Airflow.
What are you waiting for to generate code quality reports? Any suggestion for new reports? Leave your comment and help us to improve the product!