How to export SonarQube reports to PDF and Excel step by step
September 4, 2026
SonarQube allows you to view a large amount of information about the quality and security of your code. The problem arises when you need to share those results, document them for an audit, or present the status of a project to people who do not work directly with SonarQube.
How can you export SonarQube results to PDF or Excel? How can you generate a detailed report with bugs, code smells, coverage, and duplications? At bitegarden, we recommend using the Report Plugins for SonarQube™™, which allow you to turn your project metrics into reports ready to share, review, or document.
What information can you export from SonarQube?
Depending on the report and the version of SonarQube being used, you can collect information in a single document such as: Bugs and code issues, Vulnerabilities and Security Hotspots, Code smells, Code coverage, Duplication, Reliability, security, and maintainability metrics, Quality Gate and its conditions, and General project metrics.
How to generate a SonarQube PDF report
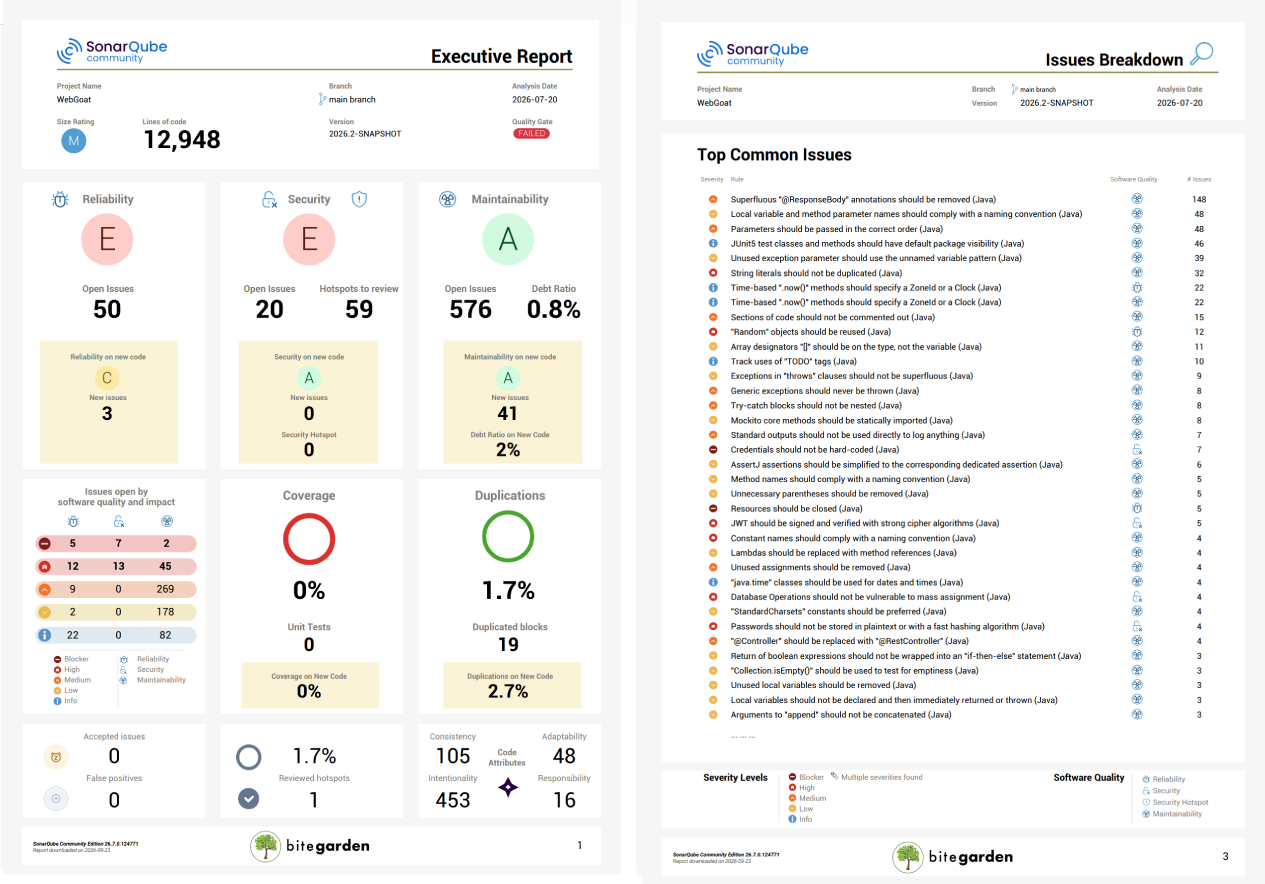
With Report Plugin for SonarQube™ Server, you can generate a PDF report directly from the SonarQube interface.
The process is simple: install the plugin, access the project you want to analyze, and generate the report from SonarQube. The PDF collects the project’s most relevant metrics and presents them in a format ready to share. The main advantage is that you do not need to manually prepare the document or copy data from SonarQube into another format.
How to export bugs, code smells, coverage, and other metrics to Excel
If you need to work with the data afterwards, an editable document may be more practical than a PDF. The Report Plugin for SonarQube™ Server allows you to create custom reports using Open Document (ODT) and Excel templates. This way, you can define how you want to present the information and add additional content to the document.
For example, you can use a corporate template to add:
-
Project information.
-
Team data.
-
Review notes.
-
Audit information.
-
Conclusions.
-
Pending actions.
The plugin automatically collects the metrics available in SonarQube and incorporates them into the template. This allows you to move from SonarQube’s technical data to a document that can be used for an internal review, audit, project meeting, or customer report.
How to generate a detailed SonarQube report
If you need more than an executive summary, the report can be used to document the status of a project in greater depth. Depending on the selected format, you can include information related to:
-
Issues: bugs, vulnerabilities, and code smells detected during the analysis.
-
Security: information related to vulnerabilities and security hotspots.
-
Quality: coverage, duplication, reliability, and maintainability.
-
Quality Gate: Quality Gate status and evaluated conditions.
This way, the report can be used both for a quick overview of the project and for a more detailed technical review.
What if you use SonarQube Cloud?
For projects analyzed with SonarQube Cloud (SonarCloud), there is Report for SonarQube™ Cloud, a specific alternative for generating reports without depending on the SonarQube Server interface. You can use it to generate anything from a one-page executive report with the main metrics to a more comprehensive report with information about: Bugs, Vulnerabilities, Security Hotspots, Code smells, Quality metrics, and Project status.
In addition, reports can be generated from a CI/CD pipeline, allowing you to automate documentation creation after specific analyses.
Automatically generating reports from CI/CD
If generating reports is part of your regular process, doing it manually after every analysis can become a repetitive task. Report for SonarQube™ Cloud can optionally be integrated into a CI/CD pipeline to automate report generation. In the case of SonarQube Cloud, once the product has been downloaded, you will have an executable .jar file.
You can place it in your file system and run it with –help to check the available options. Properties can be provided through system arguments using -D or through a custom configuration file. This allows you to incorporate report generation as another step in the continuous integration process.
PDF, Excel, or a custom report?
The choice depends on what you want to do with the results:
-
PDF: ideal for sharing a project’s status, presenting results, or creating documentation that does not need to be edited.
-
Excel: useful when you need to work with the data afterwards or analyze it in an editable format.
-
ODT: a good option when you want to use a template and adapt the document to your organization’s needs.
Why use a plugin to generate SonarQube reports?
SonarQube is primarily designed to analyze and visualize code quality. When you need to turn all that information into documentation, doing it manually can involve reviewing different screens and transferring the data to another document.
bitegarden’s Report Plugins automate this process. In just a few clicks, you can obtain an updated report with your project’s metrics and, when needed, use custom templates to adapt it to your own format.
If you need to export SonarQube to PDF, generate an Excel file with your project metrics, or create a detailed report with bugs, code smells, coverage, duplication, and security, bitegarden’s Report Plugins can considerably simplify the process.
You can download the Report Plugin for SonarQube™ Server here, and if you work with SonarQube Cloud, you can download here the Report for SonarQube™ Cloud.